Report view
The generated HTML report view presents three different tabs: a diagram tab, a measure logs tab and a source code tab. For the purpose of this guide, we will concentrate ourselves on the main tab, the diagram tab.
The diagram tab can be split up in 6 logical regions: tabs, filters, actors, conversations, transactions and details. With the exception of the tab bar, the other 5 regions are described in detail in the following subsections.
Filters

Diagram view with the filters region highlighted.
The filter bar allows to trigger different visualization modes of the different transactions, by including or excluding one or more transactions based on some criteria or by rendering a logical group of transactions differently.
The available filters and renderers are:
- Display mode
- Triggers the visualization of transactions based on their TCP flags. Possible values are all to display all transactions, hide ACK-only to show all transactions but they with only the ACK flag set, smart SYN/FIN to group transactions belonging to the same three way handshake (or the same FIN sequence) into one and rendering it appropriately or PSH only to display only transactions containing actual POP method calls or responses.
- Conversations filter
- A simple filter allowing to select or deselect visible conversations.
- BindStatus display mode
- Triggers the visualization of BindStatus calls and responses. Possible values are normal to display them as normal transactions, smart to group them into a single transaction and render it appropriately or hide to completely hide any BindStatus related transaction.
- Hide/show all details
- A simple switch to either hide all transaction details or to show them all.
Actors
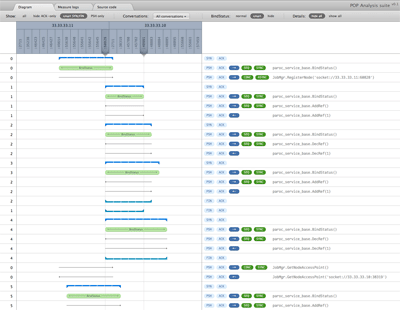
Diagram view with the actors region highlighted.
The actors region displays the different IP addresses and ports bound to each conversation. When hovering a transaction, the two peers are automatically highlighted.
This highlight mode can be fixed by clicking on a node and reset by clicking a second time.
Additionally it is possible to hide or show all conversations from/to a given actor or by clicking on it by keeping the alt or, respectively, the meta key respectively pressed.
Conversations

Diagram view with the conversations region highlighted.
The conversations region simply indicates for each transaction to which conversation it belongs to. A conversation is simply the set of all transactions which where transmitted on the same TCP connection.
The conversations are numbered, starting at zero, from the oldest to the youngest and their number corresponds to the number displayed in the Conversations filter too.
Transactions

Diagram view with the transactions region highlighted.
This region displays from which actor to which actor a transaction happened and, if the respective smart display filters are active, renders SYN/FIN and BindStatus requests accordingly.
When overing a transaction, its bounds are automatically highlights in the same way as it was for the actors above.
Details
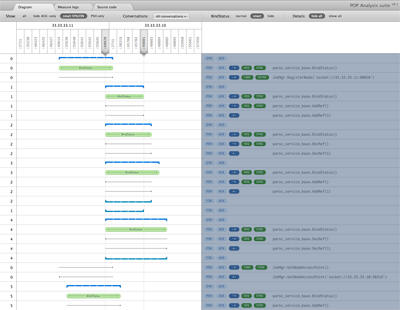
Diagram view with the details region highlighted.
This region is the most interesting and informational of the entire report.
It provides details such as TCP flags, POP invocation semantics, transaction type, called object and method, passed arguments,... simply click on the corresponding row to expand it and show all details of the transaction.
An example of expanded transaction details is displayed in the figure below; the different parts composing it are explained in deeper detail after the screenshot.
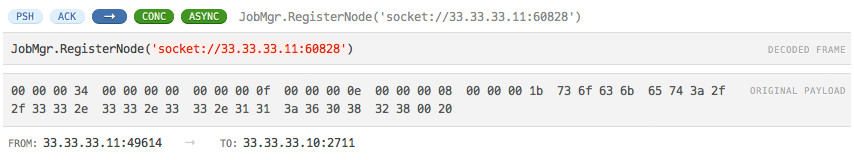
Expanded details region for a single transaction.
Starting at the top-left corner, we are presented with the TCP flags which were set for this transaction; possible values are ACK, SYN, PSH and FIN.
Just after them, on the right, the transaction type; possible values are → for a method call, <- for a reply and × for an exception.
The next flags group, in green, represents the POP call semantics; possible values for them are the well known SYNC, ASYNC, CONC, SEQ, MTX (for mutex) and CONSTRUCT (for constructor calls).
The rest of the line is dedicated to a short representation of the method call, including class name, method name and the arguments if they are not too long to be represented.
On the following line, inside the decoded frame field, the full decoded and highlighted request is represented.
The original payload shows the hex encoded original content of the payload as it was captured by tshark.
The last line only remembers, in a textual way, the two involved actors with the respective IP addresses and port numbers.
Other tabs
Other two tabs are available in the tab bar, and although not providing as much information as the diagram view, they can provide some useful insight in the measure constructions, especially for a third party person watching at the report for the first time.
Both views are file browsers but for two different file type groups:
- Logs view
- This view groups all collected log files relative to this specific measure and presents them in a simple to use file browser with no additional syntax highlighting.
- Source code view
- This view groups all source code files found in the original measure case folder and provides syntax highlighting for the different file types such as makefiles, POP-C++ headers, C++ source code,...